draw_healthbar
Draws a custom healthbar.
Syntax:
draw_healthbar(x1, y1, x2, y2, amount, backcol,
mincol, maxcol, direction, showback, showborder);
| Argument |
Description |
| x1 |
The x coordinate of the left of the healthbar |
| y1 |
The y coordinate of the top of the healthbar |
| x2 |
The x coordinate of the right of the healthbar |
| y2 |
The y coordinate of the bottom of the healthbar |
| amount |
The variable which defines total health (between 0 and
100) |
| backcol |
The colour of the background for the bar |
| mincol |
The colour of the bar when at no health (0) |
| maxcol |
The colour of the bar when at full health (100) |
| direction |
Where the bar is 'anchored' (0 = left, 1 = right, 2 = top, 3 =
bottom) |
| showback |
Whether the bar's background is drawn (true) or not
(false). If false, the backcol argument is
disregarded. |
| showborder |
Whether the bar's elements have a 1px wide black border
(true) or not (false). |
Returns: N/A
Description
With this function you can draw a coloured bar to show a
constant value. Although the function uses the word "healthbar" you
can use this to display anything you wish as long as the amount to
be displayed is a percentage value between 0 and 100 (a percentage
of any value can be calculated with the formula (CURRENT_Value /
MAXIMUM_value) * 100), so, for example, you can use this to
display power, health, mana, time or anything else that would
benefit from a bar display.
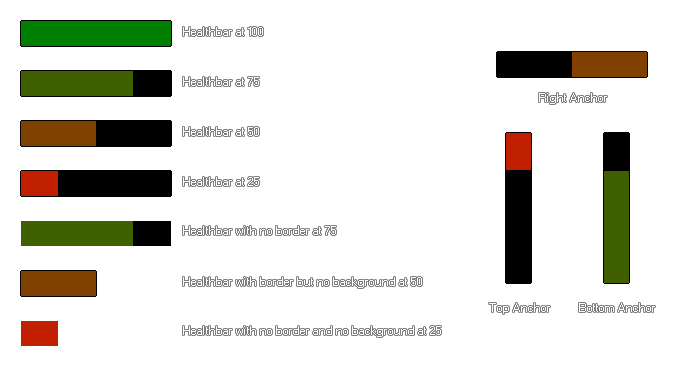
You can set various different things that change the visual aspect
of the bar and these are illustrated in the image below (note that
the colours used here are c_green for the maximum value
and c_red for the minimum value, but you can use the
colours that you wish): 
Example:
var pc;
pc = (hp / max_hp) * 100;
draw_healthbar(100, 100, 500, 200, pc, c_black, c_red, c_lime, 0,
true, true)
The above code uses the percentage value that you get from the
variables "hp" and "hp_max" to draw a standard red/green
healthbar.
© Copyright YoYo Games Ltd. 2018 All Rights Reserved
